During the same sex marriage vote, we asked Australians about their voting intentions as well as surrounding feelings to the decision-making process. Not only was this an interesting comparison of the 'for' and 'against' camps, but the results of the survey matched the real voting outcome exactly, with 62% for and 38% against.
Our aim was to understand the decision making process and the strength of the dilemmas involved. But now what? After much anticipation about how our findings would be reflected in the results, we went back to our panel to ask additional questions around the aftermath of the results before it's fully passed in the Senate.We found that both 'for' and 'against' voters showed conviction in their decision, with 90% and 93% respectively saying they had no doubts after sending off their postal vote, and 95% and 91% saying they would vote the same again today.
Difference arose, however, in the levels of passion felt by 'against' voters (84%) who seemed more so than 'for' voters (73%). ‘Against’ voters also felt there was significantly more bias from the media at 66% vs 26%, and 95% of the 'against' voters viewed the media in favour of the opposite camp in comparison to 60% of ‘for’ voters. Both were recurring themes found in the pre-result survey too.
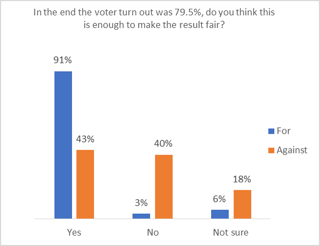
In line with the results and heightened feelings, 40% of those who voted against same-sex marraige felt that a voter turnout of 79.5% wasn’t enough to make the result fair. Understandably, when an voting outcome is not the desired one, human nature is to cast some doubt the way it was conducted or with elements contributing to the outcome. However, the gap was vast with only 3% of those voting 'for' saw it as an insufficient voter base.
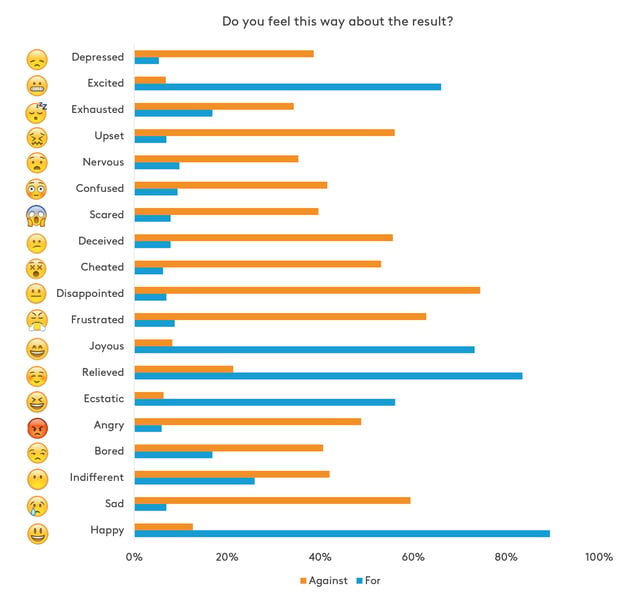
Looking at the emotional response, we observed a polarised response. Using a timed activity to measure respondent's immediate reaction to words describing the result, we found that 89% of those 'for' thought the term ‘Happy’ applied, compared to only 13% of those 'against'. On the opposite end, the most relevant word for those 'against' was ‘Disappointed’, with 74% reporting "yes" to that term. However, 47% of ‘against’ voters felt ‘Indifferent’ about the result, which might be a result of feeling sheer ‘Frustration’ (which came in at 65%) given how passionate respodents reported being throughout the rest of the findings.

Interestingly, we saw quite a varied response across the age groups. ‘Against’ voters under 35 years of age seemed to be taking the result harder than the over 35s, with 53% selecting ‘Depressed’ compared to 38%, and 87% selecting ‘Disappointed’ compared to 73%. However, voters under 35 were more ‘Excited’ (20% compared to 6%) and ‘Relieved’ (47% compared to 19%), implying the process was a more emotive one for the younger audience with a mixed bag of feelings and emotions at play.
Of the ‘for’ voters, the younger audience were again more ‘Excited’ (73% compared to 65%), but also more ‘Depressed’ (13% compared to 4%); clearly again, the emotional impact was more tumultuous.
The response between genders was fairly consistent, however we did see that female voteres 'for' were more 'Excited' than male voters (71% compared to 58%).
We also asked people how they thought various demographics voted in the election to understand the perceptions of support amongst the two groups. We found that both sides thought, in most instances, those likely to support their choice would do so in a stronger way. 'For' voters thought University Graduates supported their cause more than 'against' voters did, while 'against' voters thought Christians supported their cause more than 'for' voters did. This implyied confidence from both sides.
Only time will tell how quickly this passes legally and how Australians adopt this change. However, it is clear there remains a divide and discontent for those against the outcome. What this and our previous study have shown to us, is that with the right methods you can add a depth of understanding to this divide; which can both help explain and then hopefully steer an effective course.


