Open ended questions generally serve a specific purpose:
- What products/brand/advertisements do you recall?
- You said X, why did you say that?
- Would you purchase/recommend X? Why/why not?
These open-ended questions generate a wider spectrum of codes than the usual standard close-ended questions, especially when the codeframe is kept to a small list, a key aspect in any mobile first survey. However, open-ended questions can also produce less impactful data (sometimes termed as gibberish data) when stock standard question wording is used, as illustrated above. The key to making an open ended question valuable is to frame the question wording to be thought-provoking, making it meaningful for the respondents and making them want to share their views fully, in an environment where this is easy to do.
At Lightspeed we have been experimenting with asking questions in a more creative way to prompt respondents to use more emotive language that can tell us a bit more about our subject. Take for instance:(If you were an insurance company) what things would you do to make your company stand out from the crowd?
This will likely elicit a more emotive and well thought out response than what you might see in a typical answer from a more formulaic type of question such as:
What things make an insurance company stand out?
This kind of question framing leads itself to a sparse response that is typical of what you see from respondents in open-ended questions:
- Price
- Customer service
- Reduced premiums, etc.
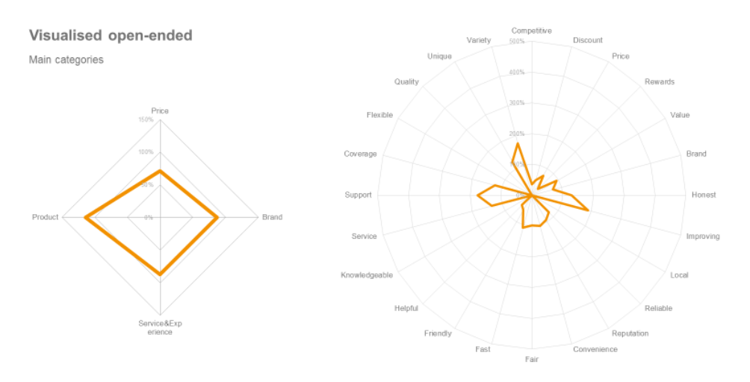
Typically, these answers are then developed into broad code frames and are quantitatively reported to get as much out of the data as we can. An insurance study we conducted recently looked at visualizing the open-ended data we collected into four broad categories, then looked at the underlying values associated with the brand.
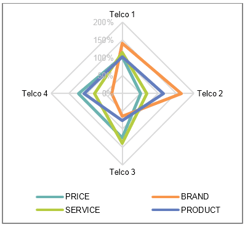
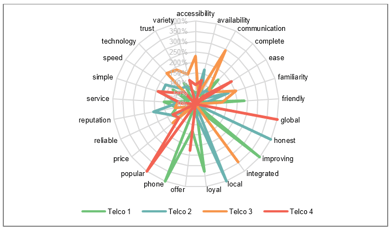
 Similarly, a previous telco study looked at the strengths of different providers. Visualising the open-ended question, it easily highlighted the core strengths and what the differentiators are. The advantages of visualising the data is how quickly it can be represented and interpreted, as shown below.


Rather than simply reducing respondents open ended answers to edible chunks and reporting at a topline level, with a less formulaic approach we can start to define clusters of words based on subject and tone.
Perhaps because they are somewhat utilitarian, open-ended questions are often phrased matter of factly and it may be due to this that a respondent will generally only answer an average of 6-8 words per open-ended question. However, simply by making it more conversational by asking through a video response question we see an average of 40-60 words. Whilst video answers are becoming more broadly adopted, working on more creative wording itself can also have a positive impact on response rate, engagement and then quality of response.
To quote Alexander Wheatley (Research Innovator at Lightspeed);
The beauty of open-ended data is that a well phrased question not only encourages the respondent to give a quantifiable expression of sentiment, but it also contains code-able and quantifiable data from a variety of aspects
Too often an open-ended question is utilised formulaically with an eagerness to reduce the data to its simplest quantifiable core. In this market, making the most out of your survey and respondent is key; utilisation of open-ended questions deserves to be given the same amount of time as the rest of the data set. Do this and the insights you can open up are endless.


