Research has consistently shown that all panels are not the same. Recruitment sources and management practices vary, and this can cause differences among panels. Beyond panels, there are other sources of online survey respondents, such as river, dynamic, and social media sources – and these can produce data that is different from each other, as well as different from panels. Given the wide variety of sample sources, and their benefits and drawbacks in cost and quality, researchers often struggle with the question, “How can I blend in other sources without impacting my data?”
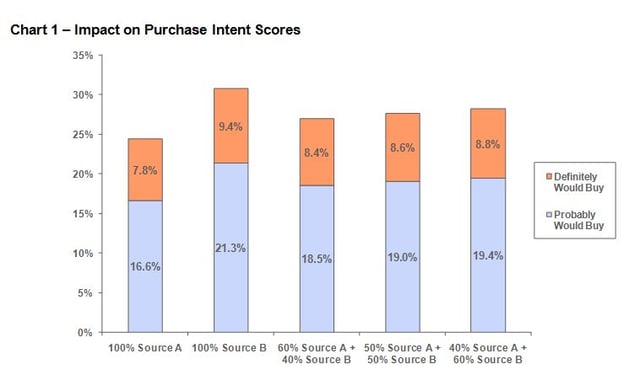
To help our clients answer this question, Lightspeed GMI modeled the impact of adding in a second source of online respondents. For this exercise we are considering two sources – Source A and Source B. The assumption is that Source A is the primary source and there is a need to blend in Source B. There are differences in the scores between the two sources for the concept measures. For example, the purchase intent scores are higher for Source B:

Given the differences, adding in Source B has the potential to impact the scores. However, it takes a large influx of Source B to impact results (see Chart 1 – Impact on Purchase Intent Scores). The proportion of respondents saying they definitely would buy goes from 7.8% to 8.6% when the sample blend is 50% Source A and 50% Source B. The percentage saying they probably would buy goes from 16.6% to 19.0%. Neither change is statistically significant with a typical base of 400 respondents and a 95% confidence level.

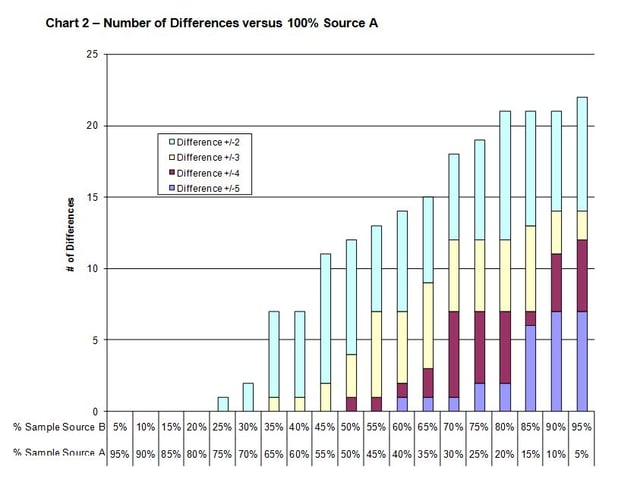
Another way to look at the impact is to examine the number of differences on scores in the blended sample compared to 100% of Source A (see Chart 2 – Number of Differences versus 100% Source A). By adjusting the proportion of sample coming from each source, it is possible to identify the point at which concept scores are impacted. Five key concept measures have been evaluated (purchase intent, uniqueness, liking, relevancy, and likelihood to recommend). For example, when 75% of the sample is from Source A and 25% from Source B, only one difference of +/-2% is observed versus a 100% Source A sample. Even when the sample is adjusted to a 55/45 blend all the differences are less than or equal to +/-3, which in most cases is not statistically significant.

The data suggests that as long as additional sources account for 40% or less of the total sample, data should not be impacted.
However, Lightspeed GMI recommends a more conservative cap of 25-30%. Because there are several situations that may call for an even more conservative blend, consider the following before making any changes:
- Tracker and wave studies – Trendability is key in tracker and wave studies. Rather than making one big change it is better to make a series of small changes (+/-10%) from week to week or wave to wave and monitor the impact.
- Unproven panel and dynamic sources – Until the quality of an unproven source is understood it is better to be conservative in the amount blended in.
- Low incidence studies – We have seen a higher proportion of questionable behavior on low incidence studies, so it is important to be more conservative when making changes.
This analysis also shows that we don’t have to maintain an exact source blend for trackers (e.g., 50% Source X and 50% Source Y), which allows us to more efficiently use sample. As long as we are within +/-5 to 10% for each source (e.g., 40-60% Source X), data will not be impacted.


